|
|
Math 121 - Calculus for Biology I |
|
|---|---|---|
|
|
San Diego State University -- This page last updated 26-Jan-08 |
|
|
|
Math 121 - Calculus for Biology I |
|
|---|---|---|
|
|
San Diego State University -- This page last updated 26-Jan-08 |
|
Outline of Chapter
The most common technique for fitting a straight line to data is the linear least squares best fit or linear regression. (The term regression comes from a pioneer in the field of applied statistics who gave the least squares line this name because his studies indicated that the stature of sons of tall parents reverts or regresses toward the mean stature of the population.)
Finding the C period for E. coli
|
|
Pulse Labeling Experiment
|
|
|
|
|
|
|
|
|
|
|
|
The least squares best fit to the data is given by the line
The t-intercept is 42.7, so this model estimates the C period as 42.7 min.
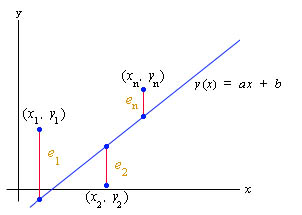
The least squares best fit is found by finding the minimum value of the function
The technique for finding the exact values of a and b uses Calculus of two variables. The formulae for finding a and b can be found in any book on statistics. A hyperlinked appendix is provided to give you these formulae, but this is only provided for completeness and not as part of this course. You will learn much more about this topic in your Biostatistics course (Biology 215).
Worked Example:
Hyperlinked section to Worked Examples related to the homework problems.
Alternate Image - Alternate link
The resulting least squares best fit to the data is given by the line
The square of the error is found to be
Calculating Percent and Relative Error
There are a number of techniques for computing the error in a measurement. Let Xe be an experimental measurement and Xt be the theoretical value. In this course, most often Xe will be the value from a model that we want to test, while Xt will be results from actual data that we acquire and assume is true. The actual error is simply the difference between the experimental (or model) value and the theoretical (or actual data) value. So the actual error is given by
Often we only need the magnitude of the error or as in the case of the least squares best fit the error is squared making the sign of the error irrelevant. In this case, we use the absolute error, which is simply the absolute value of the difference between the experimental (or model) value and the theoretical (or actual data) value. So the absolute error is given by
More often the error is presented as either the relative error or percent error. This error allows a better comparison of the error between data sets or within a data set with large differences in the numerical values. The relative error is the difference between the experimental (or model) value and the theoretical (or actual data) value divided by the theoretical (or actual data) value, so
The percent error is closely related to the relative error, except that the value is multiplied by 100% to change the fractional value to a percent, so
[1] J. L. Ingraham, O. Maaloe, and F. C. Neidhardt, Growth of the Bacterial Cell, Sinauer Assoc., Inc., Sunderland, MA, 1983.
[2] Ruth Kavenoff and Brian Bowen, Bluegenes #1, Designergenes Posters, ltd., 1989.
[3] F. C. Neidhardt, Escherichia coli and Salmonella typhimurium: Cellular and Molecular Biology, American Society of Microbiology, Washington, D.C., 1987.