|

|
Math 121 - Calculus for Biology I
Spring Semester, 2004
Quotient Rule
|
|
|
|
© 2001, All Rights Reserved, SDSU
& Joseph M. Mahaffy
San Diego State University -- This page last updated 10-Jan-04
|
|

- Hemoglobin Affinity for O2
- Quotient Rule
- Graphing Example
- Worked Examples
- Dissociation Curve for Hemoglobin
- Mitotic Model
- References
- The quotient rule is developed to examine the maximum rate
of change in O2 affinity by hemoglobin
- It is used for graphing of rational functions - locating
minima and maxima
Hemoglobin
Affinity for O2
- Hemoglobin is
the most important molecule in erythrocytes (red blood cells)
- It has evolved to carry O2 from the lungs and
remove CO2 from the tissues
- For humans, the hemoglobin molecule consists mainly of two
a and two b
polypeptide chains
- Each polypeptide chain contains a porphyrin ring with iron
near the active binding site
- The four polypeptide chains fold into a quaternary structure
that has evolved to very efficiently bind up to four molecules of O2
- Oxygen is required by all of our cells
- Hemoglobin uses cooperative
binding to effectively load and unload O2 molecules
- In cooperative binding, the binding of one molecule facilitates
the binding of one or more other molecules
- Cooperative binding is often seen where a steep dissociation
curve is needed
- It is a variant of the Michaelis-Menten
velocity curve with a characteristic S-shape
- The protein has more of an on/off function
- The steepness in the dissociation curve is needed for effective
O2 exchange
- A small partial pressure difference in the concentration
of O2 results in easy unloading of O2 at the tissues
- In the lungs, the O2 readily loads onto the
hemoglobin molecules
- A different dissociation curve allows the removal of
CO2
- Ranney and Sharma [1] give the
kinetic dissociation curve for hemoglobin
- The dissociation curve for hemoglobin is highly sensitive
to pH, temperature, and other factors
- Oxygen affinity is expressed by a dissociation function
that measures the percent of hemoglobin in the blood saturated with O2
as a function of the partial pressure of O2
- The fraction of hemoglobin saturated with O2
satisfies the function
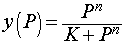
- y is the fraction
of hemoglobin saturated with O2
- P is the partial
pressure of O2 measured in torrs
- The Hill coefficient n
represents the number of molecules binding to the protein
- K is the binding
equilibrium constant
- Hemoglobin has a Hill coefficient of 2.7-3.2 though it can
bind cooperatively up to 4 molecules of O2
- Experimental measurements show that the values of n
and K are 3
and 19,100, respectively
- Below is a graph of the O2 saturation curve
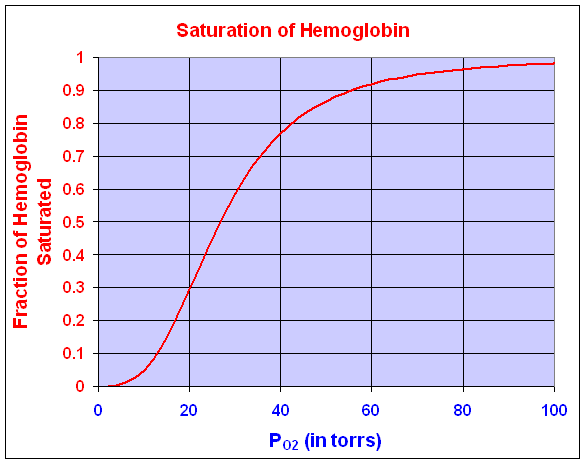
- Where the dissociation curve is steepest, the O2
binds and unbinds to hemoglobin over the narrowest changes in partial pressure
of O2
- This allows the most efficient exchange of O2
in the tissues
- The steepest part of the dissociation curve is where the
derivative is at its maximum
- This is the point of inflection
- The curve is defined by a rational function, so we need
a quotient rule to find its derivative
Quotient
Rule
- Let f(x) and g(x) be two differentiable
functions
- The quotient rule
for finding the derivative of the quotient of these two functions is given
by
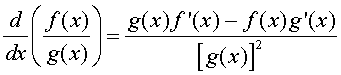
- f '(x) and g'(x) are the derivatives
of the respective functions
- In words, the quotient rule says that the derivative of
the quotient is "the bottom times the derivative of the top minus the top
times the derivative of the bottom all over the bottom squared."
Example:
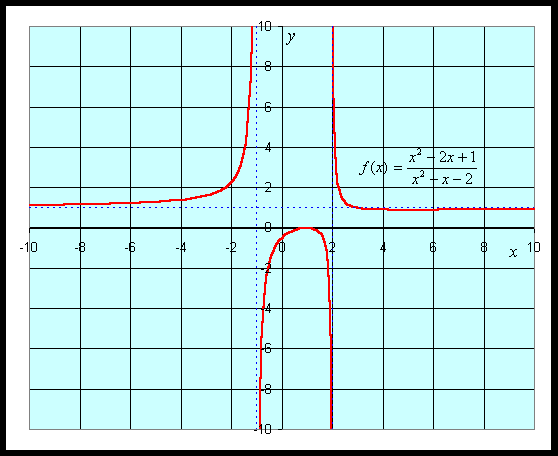
Consider the function
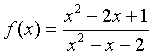
Sketch a graph of this function.
Solution:
Intercepts
- The y-intercept is given by y = f(0) = -1/2
- The x-intercept solves
f(x) = 0
- Set the numerator equal to zero
x2 - 2x + 1 = (x
- 1)2 = 0
Asymptotes
- The vertical asymptotes are when the denominator is zero,
so
x2 - x -2 = (x
+ 1) (x - 2) = 0
- The vertical asymptotes are x = -1 and x = 2
- The horizontal asymptote examines f(x) for large values of
x
- The largest exponents in the numerator are both 2
- For large x, f(x) behaves like x2/ x2 = 1
- The horizontal asymptote is y = 1
Extrema
- The derivative uses the quotient rule

- The critical points are found by setting the derivative
equal to zero
- Set the numerator equal to zero or
x2 - 6x + 5 = (x
- 1) (x - 5) = 0
- The critical points are xc = 1 and xc = 5
- Evaluating the function f(x) at these critical points
- Local maximum at (1, 0)
- Local minimum at (5, 8/9)
Dissociation
Curve for Hemoglobin
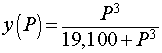
- The dissociation curve for O2 with hemoglobin
shown above uses the specific function
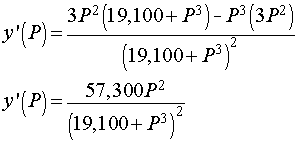
- Compute the derivative using the quotient rule
- Below is the graph of this derivative
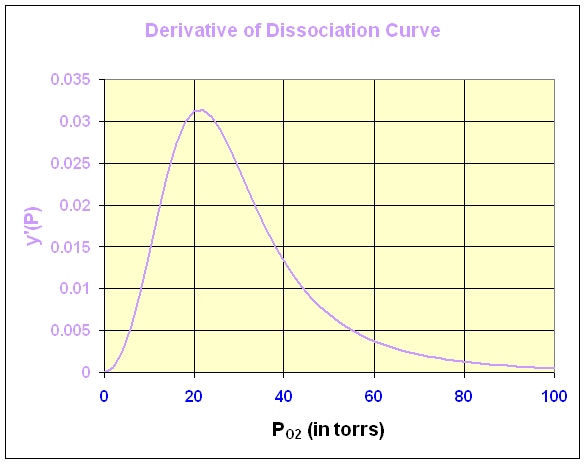
- The maximum derivative occurs at about PO2
= 21 torrs
- The exact value of the maximum derivative uses the second
derivative equal to zero
- The second derivative is
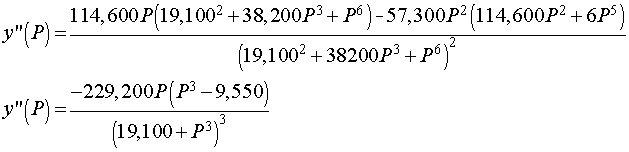
- The last expression requires some algebra or Maple
- The second derivative is equal to zero when either P
= 0 or 95501/3 = 21.22
- The point of inflection occurs at P
= 21.22
with y(P)
= 0.333 or about 1/3 of the hemoglobin is saturated by O2
Mitotic
Model
- Multicellular organisms
- First cell grow exponentially (Malthusian growth)
- Cell growth regulated to develop particular patterns
and shapes
- Cells differentiate into organs with specific functions
- Adult organisms maintain a constant number of cells
- Mitosis is the
process of cellular division
- Cancer is the breakdown of control in cellular division
- How does a cell recognize when it should divide?
- Cells must recognize their neighboring environment of
other cells
- For example, a skin cell obviously needs to undergo
mitosis when either wear or damage of the skin requires replacement cells
- The regulation of mitosis
is very important
- One controversial biochemical theory (late 1960s) was that
cells communicated with neighboring cells by tissue-specific inhibitors known
as chalones
- Chalones are released by cells and diffuse in the environment
- With sufficient quantities of chalones, cells are inhibited
from undergoing mitosis
- Theory assumes that chalones bind specifically to certain
proteins involved in mitosis
- The chalones inactivate the mitotic proteins, leaving the
cell in a quiescent state
- The inhibition process of effector molecules binding to
a protein is often modeled using a Hill function
- Let Pn
represent a cell density at a particular time n
(Pn+1
is the next time period)
- An appropriate mathematical model for the cell density
- With mitotic divisions and cell loss
- Dependent on the cellular density with inhibition
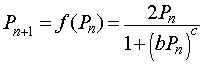
- b and c are parameters that fit the data based on
chalone kinetics
- The function f(Pn)
is known as an updating function
- When the cell density Pn is very low, then the denominator of the
model is insignificant
Pn+1
= 2Pn,

- Determine what the cell density is at equilibrium
- Graph the updating function f(Pn)
- Give some biological interpretations
Equilibria of the Mitotic
Model
- At equilibrium, the population density is the same at all
time intervals
Pn+1 = Pn = Pe
- Substituting into the model
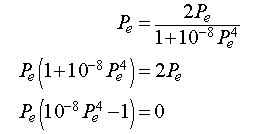
- The equilibria are Pe = 0
or Pe = 100
- First equilibrium is the trivial equilibrium (no cells
exist)
- The second equilibrium is the preferred density of cells
in a particular tissue
Graphing the Mitotic Updating
Function
- To graph f(Pn),
examine the intercepts, asymptotes, and any extrema
- The only intercept is (0, 0),
the origin
- The denominator is always positive, so no vertical asymptotes
- The power of Pn in the denominator
is 4, which exceeds the power of Pn in the numerator
- There is a horizontal asymptote at
y = 0.
- To find any extrema, differentiate f(Pn)

- Setting this derivative equal to zero
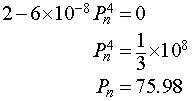
- The maximum of the updating function occurs at
(75.98, 113.98)
- Below is a graph of the updating function
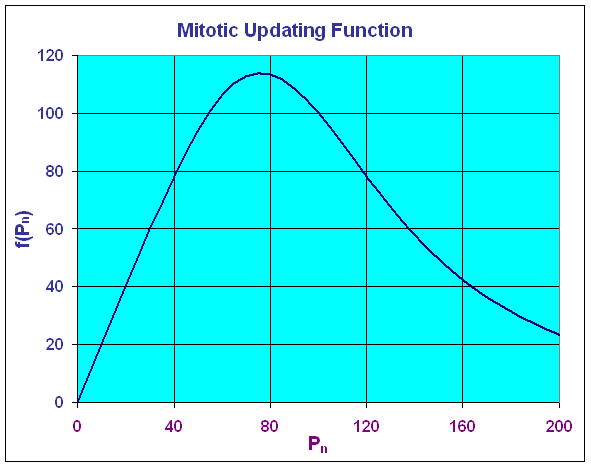
- The graph shows that the greatest production of cells occurs
at a cell density of 75.98
- At a cell density of Pn
= 100, the production equals the number dying - the model is at
equilibrium
- For fairly high density, this model predicts a toxic effect
from the crowding
- This gives a major die-off so that the next time period
has a very low density
- This model is very simplistic, but it does demonstrate some
of the important concepts behind biochemical inhibition
References
[1] W. S. Bullough and E. B. Laurence (1968) Chalones and cancer,
Nature 220, 134-135.
[2] H. M. Ranney and V. Sharma, Structure and function of hemoglobin,
in Willliam's Hematology, eds. E. Beutler, M. A. Lictman, B. S. Coller,
T. J. Kipps, 5th Edition, 1995, p. 417-425.