![]()
Math 121 - Calculus for Biology I
Spring Semester, 2009
Introduction to the Derivative
San Diego State University -- This page last updated 14-Mar-09
|
|
Math 121 - Calculus for Biology I |
|
|---|---|---|
|
|
San Diego State University -- This page last updated 14-Mar-09 |
|
Introduction to the Derivative
The Derivative as a Growth Rate
where t0 and t1 are successive ages with heights h(t0) and h(t1)
Examples for girls,
|
|
|
|
|
|
|
|
|
|
|
|
Example for boys,
|
|
|
|
|
|
|
|
|
|
|
|
|
|
|
|
|
|
|
|
|
|
|
|
|
|
|
|
|
|
|
|
|
|
|
|
|
|
|
|
|
|
|
|
|
|
|
|
|
|
|
|
|
|
|
|
|
|
|
|
|
The growth rate for the population of yeast
With more data, we might expect a smoother growth curve
It is very important to note that the graph of the yeast population (above) and the graph of the growth of the yeast population (below) are different graphs, but are related through the slope of the population graph
The derivative will be the instantaneous growth rate at any time for any population curve
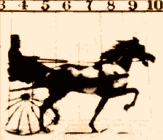
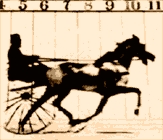
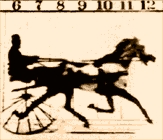
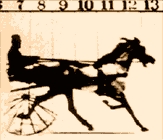
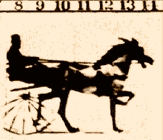
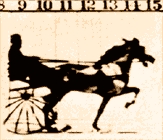
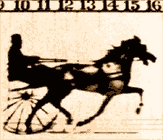
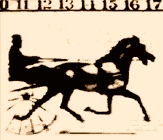
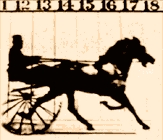
Study of a trotting horse
|
Image 1, time = 0 sec |
Image 2, time = 0.04sec |
Image 3, t = 0.08 sec |
Image 4, t = 0.12 sec |
Image 5, t = 0.16 sec |
|
|
|
|
|
|
|
Image 6, t = 0.2 sec |
Image 7, t = 0.24sec |
Image 8, t = 0.28 sec |
Image 9, t = 0.32 sec |
Image 10, t = 0.36 sec |
|
|
|
|
|

|
Velocity
which is approximately the same
An average velocity for the entire sequence is computed by taking the initial and final positions of the head and dividing by the total time between the frames
Example 4: Falling under the influence of Gravity
If we look once every 10 seconds, we see

Consider 5 second intervals instead

Now consider 1 second intervals of time.

Example 5: Falling Ball
Change the time between strobe flashes by entering different values in the window. The left frame shows the position of the ball as it drops, while the right frame graphs the position as a function of time.
References
[1] T. Carlson Über Geschwindigkeit und Grösse der Hefevermehrung in Würze. Biochem. Z. 57: 313-334, 1913.