|

|
Math 121 - Calculus for Biology I
Spring Semester, 2004
Applications of the Derivative
|
|
|
|
© 2001, All Rights Reserved, SDSU
& Joseph M. Mahaffy
San Diego State University -- This page last updated 01-Jan-04
|
|
 Applications of the Derivative - Graphing
- Temperature Fluctuation during Menstrual
Cycle
- Maxima, Minima, and Critical
Points
- Graphing Polynomials
- Second Derivative
and Concavity
- Points of Inflection
- Worked Examples
Applications of the Derivative
- Finding Maxima, Minima, and Steepest parts of a Function
- Classical Calculus application - Sketching the graph of
a function
Body Temperature Fluctuation during
the Menstrual Cycle
- Mammals regulate their body temperature in a narrow range
to maintain optimal physiological responses
- Variations in body temperature occur during exercise, stress,
infection, and other normal situations
- Neurological control of the temperature
- Variations include
- Circadian rhythms (a few tenths of a degree Celsius)
- Menstrual cycle - Ovulation often corresponds to the
sharpest rise in temperature
- Graph of the basal body temperature taken at the same time
each day for a one 28-day period of one woman
- The data are fit by a cubic polynomial
- The best cubic polynomial fitting the data above is
T(t) = -0.0002762 t3 + 0.01175 t2 - 0.1121 t
+ 36.41
- Want to find the high and low temperatures
- Determine the time of peak fertility when the temperature
is rising most rapidly
Maxima and Minima
- The high and low temperatures occur when the curve has slope
of zero
- Find the derivative equal to zero
- The derivative of the temperature is
T '(t) = -0.0008286 t2 + 0.02350 t
- 0.1121
- Note that the derivative is a different function from the
original function
- The roots of the derivative (quadratic equation) are
t
= 6.069 and 22.29 days.
Minimum
at t
= 6.069 with T(6.069)
= 36.1 oC
Maximum
at t = 22.29
with T(22.29) = 36.7
oC
- There is only a 0.6 oC
difference between the high and low basal body temperature during a 28 day
menstrual cycle by the approximating function
- The data varied by 0.75 oC.
Maximum Increase in Temperature
- The maximum increase in temperature is when the derivative
is at a maximum
- This is the vertex of the quadratic function, T
'(t)
- The maximum occurs at the midpoint between the roots of
the quadratic equation
- Alternately, the derivative of T
'(t) or the second derivative of T(t) equal to zero gives the maximum
- The second derivative is
T "(t) = -0.0016572 t + 0.02350
- The second derivative is zero at the
Point of
Inflection at t
= 14.18 with T(14.18)
= 36.4 oC.
- The maximum rate of change in body temperature is
T '(14.18)
= 0.054 oC/day.
- This model suggests that the peak fertility occurs on day
14, which is consistent with what is known about ovulation
Worked Examples
Maxima, Minima, and Critical Points
- The derivative is zero at critical points for the graph
of a smooth function
Definition: A smooth
function f(x) is said to be increasing on an interval (a,b) if f '(x) > 0 for all x
in the interval (a,b). Similarly, a smooth function f(x) is said to be decreasing
on an interval (a,b) if f
'(x) < 0 for all x in the interval (a,b).
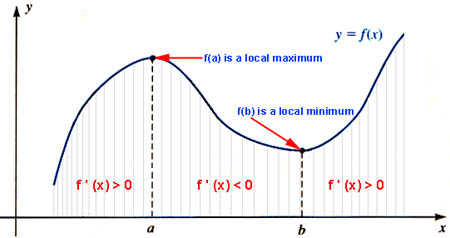
- A high point of the graph is where f(x) changes from increasing
to decreasing
- A low point on a graph is where f(x) changes from decreasing to increasing
- In either case the derivative passes through zero
Definition: A smooth
function f(x) is said to have a local maximum at a point c, if f '(c) = 0 and f
'(x) changes from positive to negative for values of x
near c. Similarly, a smooth function f(x) is said to have a local
minimum at a point c, if
f '(c) = 0 and f
'(x) changes from negative to positive for values of x
near c.
Definition: If f(x) is a smooth function
with f '(xc) = 0, then xc is said to be a critical point of f(x).
- Critical points help find the local high and low points
on a graph, but some critical points are neither maxima or minima
Graphing Polynomials
Example:
Consider
f(x) = x3 - 6x2 - 15x
+ 2
Sketch a graph of f(x).
Solution:
f
'(x) = 3x2 - 12x
- 15 = 3(x + 1)(x - 5)
- The derivative is zero when xc = -1 or
5
- Since f(-1) = 10, a local maximum
occurs at (-1,10)
- Since f(5)
= -98, a local minimum occurs at (5,-98)
- The y-intercept is (0,2)
This gives enough for a reasonable sketch of the graph. Note
that since this is a cubic equation, the x-intercepts
are very hard to find.
The Second Derivative and Concavity
- Since the derivative is itself a function, then if it is
differentiable, one can take its derivative to find the second derivative often denoted
f ''(x)
- If the first derivative is increasing or the second derivative
is positive, then the original function is said to
be concave upward
- If the first derivative is decreasing or the second derivative
is negative, then the original function is said to be concave
downward
- The second derivative is a measure of the concavity of a
function
- For smooth functions, the maxima generally occur where the
function is concave downward, while minima occur where the function is concave
upward
The Second Derivative Test.
Let f (x) be a smooth function. Suppose that f '(xc) = 0, so xc is a critical point of f. If f ''(xc) < 0, then
xc is a relative maximum. If f ''(xc) > 0, then
xc is a relative minimum.
Example:
For
f(x) = x3 - 6x2 - 15x
+ 2
f ''(x) = 6x - 12
- The critical points occurred at
xc = -1
and 5
- The second derivative at the critical point xc = -1 gives
f
''(-1) = -18
- The function is concave downward at -1, so this is a relative
maximum
- The second derivative at the critical point xc = 5 is
f
''(5) = 18
- The function is concave upward, so this is a relative minimum.
Points of Inflection
- When the second derivative is zero, then the function is
usually changing from concave upward to concave downward or visa versa
- This is known as a point of
inflection
- A point of inflection is where the derivative function
has a maximum or minimum, so the function is increasing or decreasing most
rapidly
- From an applications point of view, if the function is describing
a population, then the point of inflection would be where the population is
increasing or decreasing most rapidly
- The point of inflection measures when the change of a function
is its greatest or smallest.
- From a graphing perspective, the point of inflection shows
the visual change in concavity
- It is not nearly as important as extrema, but does provide
one more point to aid in graphing the function
Example: For
f(x) = x3 - 6x2 - 15x
+ 2
The second derivative is
f ''(x) = 6x
- 12
The point of inflection is f ''(x) = 0 which is when x = 2
The point of inflection occurs at (2,
-44)
Worked Examples