|
Math 121 - Calculus for Biology I |
||
|---|---|---|
|
San Diego State University -- This page last updated 08-Jan-03 |
Other Functions and Asymptotes: Examples
|
Math 121 - Calculus for Biology I |
||
|---|---|---|
|
San Diego State University -- This page last updated 08-Jan-03 |
Example 1: Let us solve the following equation:
Solution: We factor this equation into the following:
Thus, the solution is given by x = -2, -1, 1, and 2.
Example 2: Let us solve the following equation:

Solution: Provided x is not 6, we can multiply through by x - 6 giving:
Thus, x = 4 or 5.
Example 3: Consider the function

Find the domain of the function and the x and y-intercepts. Determine any vertical or horizontal asymptotes. Sketch the graph of this function.
Solution: When the denominator of a rational function approaches zero, the value of the function approaches positive or negative infinity. Therefore, these values for x must be excluded. Since the denominator is zero when x = 3, the domain is all real numbers, such that x ¹ 3. The y-intercept is found by substituting x = 0, so y = 2/(-3) = -2/3. The x-intercept is found by solving (x+2)/(x-3) = 0 or x + 2 = 0, so x = -2.
Since the degree of the numerator is equal to the degree of the denominator, there is a horizontal asymptote. For large x, we can neglect the constants in the numerator and the denominator. It follows that
![]()
Thus we have a horizontal asymptote at y = 1. The denominator is zero at x = 3, so there is a vertical asymptote at x = 3. The graph of the above function is shown below, with the asymptotes drawn in red.

Example 4: Consider the function

Find the domain of the function. Determine any vertical or horizontal asymptotes. Sketch the graph of this function.
Solution: The domain of the function is again determined by finding when the denominator equals zero. The denominatoris easily factored, so
x = ±2
Therefore, our domain is all real numbers such that x ¹ ±2. The values excluded from the domain represent vertical asymptotes. Thus, we have two vertical asymptotes at x = -2 and x = 2.
Since the degree of the numerator (2) is equal to that of the denominator, we have a horizontal asymptote.
Letting x approach positive or negative infinity, we can ignore the 4 in the denominator to obtain:
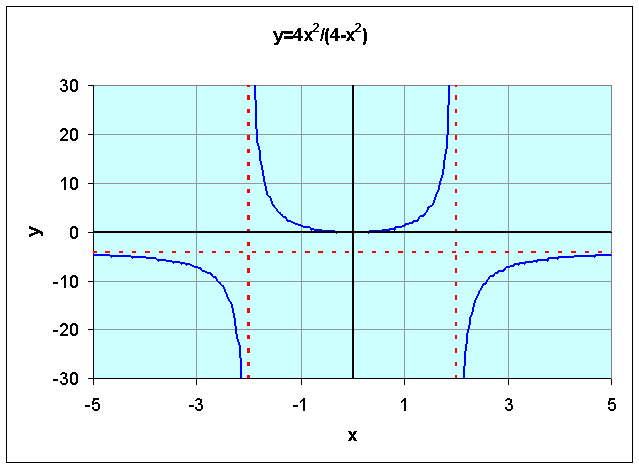
The horizontal and vertical asymptotes are drawn in red on the graph above.
Example (Lineweaver-Burk Plot): The Michaelis-Menten rate function traces out a hyperbola. Suppose we write the velocity function as

If we take the inverse of this expression, we have

If we let y = 1/V and x = 1/[S], then the equation above is easily seen to form a line.

The slope of this line is Km/Vmax, the y-intercept is 1/Vmax, and the x-intercept is -1/Km. Below is a graph of this straight line, the Lineweaver-Burk plot.

Thus, by graphing 1/V versus1/[S], with data on an enzyme (forming a line), the Lineweaver-Burk allows easy identification of the Michaelis-Menten constant Km and the maximum velocity Vmax.
Example 5: Suppose an enzyme satisfies the equation

a. Sketch a graph of this function for 0 < [S] < 100. Find any horizontal asymptotes.
b. Determine the linear equation for x = 1/[S] and y = 1/V, then create the Lineweaver-Burk plot. Find the intercepts on the x and y axes. What is the slope for this line?
Solution:
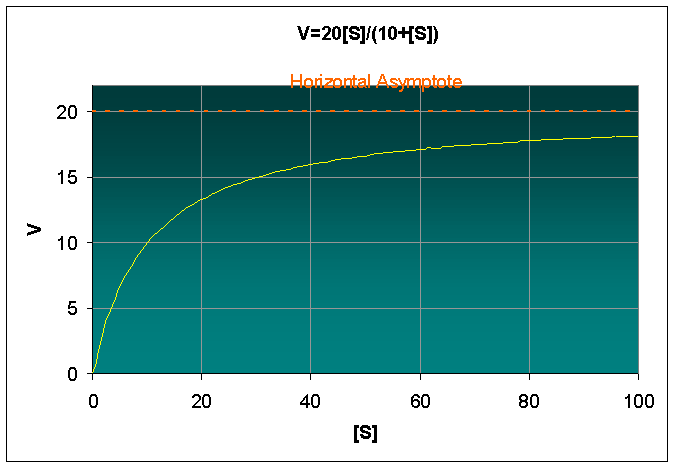
a. Before graphing, it is helpful to find any asymptotes. Since the degree of the numerator (1) is equal to that of the denominator, we have a horizontal asymptote. As S approaches positive infinity, we can ignore the 10 in the denominator, and we find a horizontal asymptote at y = 20. The asymptote is drawn in red in the graph below.
b. For x = 1/[S] and y = 1/V, we have [S] = 1/x and V = 1/y. Substituting these into the given equation, and solving for y, we obtain

or

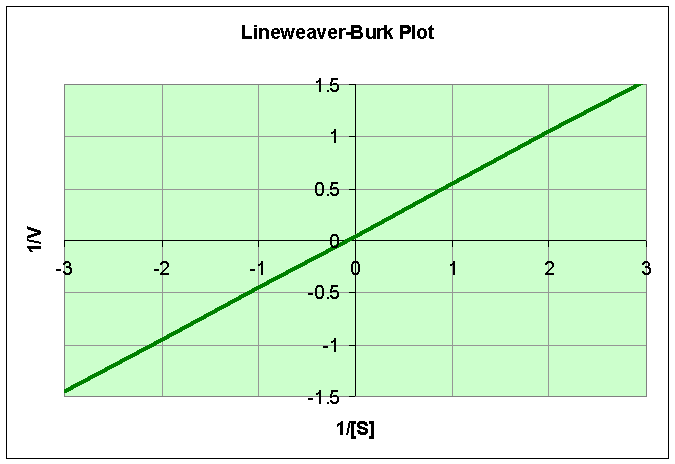
The slope of this line is 1/2, and the y-intercept is 1/20. The x-intercept is found by setting y = 0, and solving for x. Therefore, the x-intercept is equal to -1/10.
Example 6: Consider the following functions with square roots. Find the domains and ranges of these functions, then sketch their graphs.
![]()
Solution:
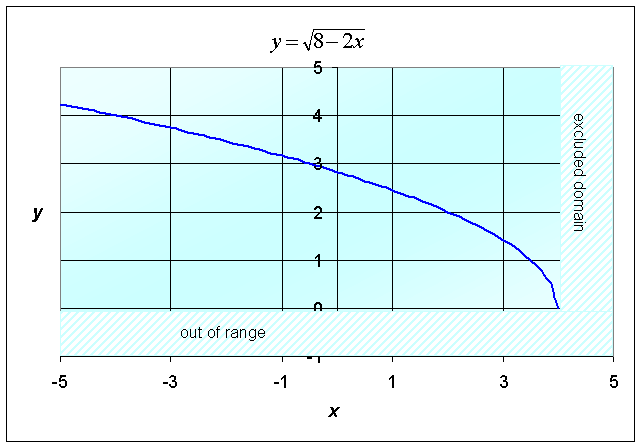
a. The quantity under the square root sign must be positive, so to find the domain we must first solve
Thus, the domain is x < 4. The range can be seen from the graph below and satisfies y > 0. The graph of the function is as follows:
b. The quantity under the square root sign must be positive, so to find the domain we must first solve
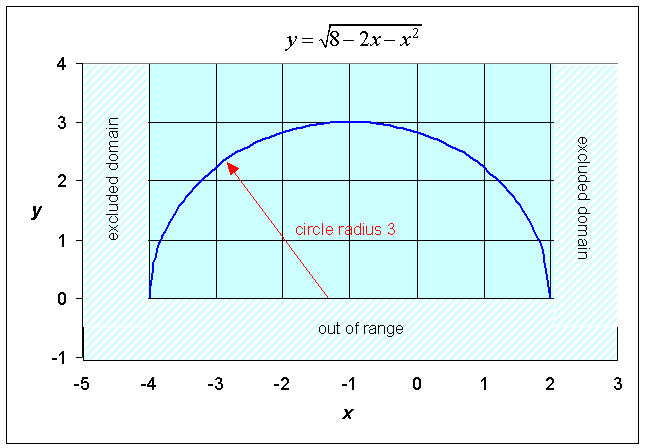
To solve this, we first determine when 8 - 2x - x2 = (4 + x)(2 - x) = 0 or x = -4 and 2. These values give the boundary of the domain. Its not hard to see that the domain is given by -4 < x < 2. (This quadratic function is positive in this interval and negative outside this interval.) The largest value under the radical occurs when x = -1 with a value of 9. Thus, the range of the function is given by 0 < y < 3. This can also be seen from the graph below. (This graph is a semi-circle.)
