Math 121 - Calculus for Biology I
Spring Semester, 2001
Introduction to the Derivative - Examples
San Diego State University -- This page last updated 11-Apr-00
|
|
Math 121 - Calculus for Biology I |
|
|---|---|---|
|
|
San Diego State University -- This page last updated 11-Apr-00 |
|
Example 1: In developing his Project Calculus course, David Smith measured the growth of his Golden Retriever puppy, Sassafras. Below is a table showing the growth of his puppy.
|
|
|
|
|
|
|
|
|
|
|
|
|
|
|
|
|
|
|
|
|
|
|
|
|
|
|
|
|
|
|
|
|
|
|
|
|
|
|
|
|
|
|
|
|
|
|
|
Find the average weekly growth rate of the puppy over the first 10 weeks. Estimate the weekly growth rate of the puppy at age 10 weeks using the data at 70 and 101 days. What is the weekly growth rate between days 230 and 436?
Solution: The first 10 weeks is equivalent to the first 70 days. The weight at day 0 is 3.25 lbs, while its 19 lbs at 10 weeks. Thus, the average growth rate is computed as follows:

To compute the weekly growth rate at 10 weeks, we see

Similarly, the weekly growth rate between 230 and 436 days is given by

Example 2: Below is a table from G. F. Gause, The Struggle for Existence, showing the population of Paramecium caudatum over a period of 15 weeks.
|
Week |
Individuals (/0.5cc) |
|
0 |
2 |
|
2 |
10 |
|
3 |
10 |
|
4 |
11 |
|
5 |
21 |
|
6 |
56 |
|
7 |
104 |
|
8 |
137 |
|
9 |
165 |
|
10 |
194 |
|
11 |
217 |
|
12 |
199 |
|
13 |
201 |
|
14 |
182 |
|
15 |
192 |
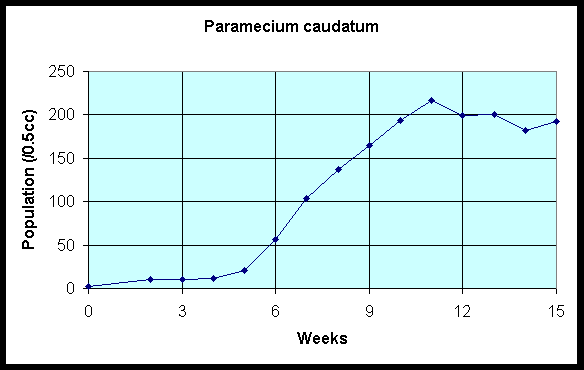
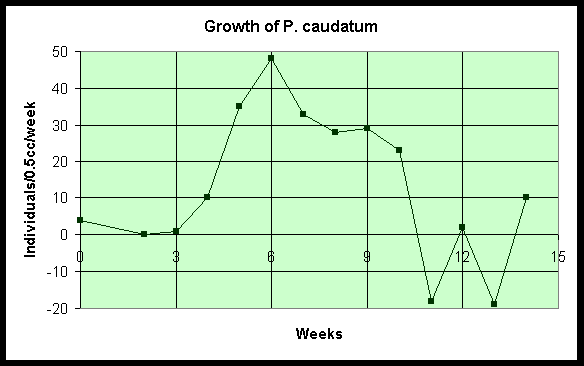
Plot a graph of the number of Paramecium caudatum as a function of time (weeks). Then plot the rate of growth of the population as a function of time using two continguous rows in the table (associating the rate of growth with the earlier time). What is the growth rate near week 7?
Solution: Below is a graph of the data above showing the population as a function of number of weeks.

The growth rate for the first two weeks requires taking the difference of the populations and dividing by two, while all other growth rates are found by simply subtracting the populations between two successive rows in the table. The resulting graph is shown below.

It is easy to see that the growth rate around Week 7 is 137-104 = 33 (individuals/0.5 cc/week).
Example 3: A steel ball, which is dropped from a height of 4 m, has its height measured every 0.1 seconds. The table below shows how far the ball has dropped at each time period.
|
|
|
|
|
|
|
|
|
|
|
|
|
|
|
|
|
|
|
|
|
|
|
|
|
|
|
|
|
|
|
|
|
Find the average speed of the ball over the 0.9 seconds of the experiment. Also, determine the average speed of the ball between 0.5 and 0.7 seconds.
Solution: The average speed of the ball over the 0.9 seconds of the experiment is given by

The average speed between 0.5 and 0.7 seconds is given by

Example 4: A skydiver encounters a significant amount of air resistance when free falling (and more significantly when the parachute opens), so his speed will not match the parabolic curve we saw in the applet in the notes. The table below gives typical values of a skydiver who, when released at about 10,000 ft, free falls for 45 seconds. The table below gives the time and the distance above the ground.
|
|
|
|
|
|
|
|
|
|
|
|
|
|
|
|
|
|
|
|
|
|
|
|
|
|
|
|
|
|
|
|
|
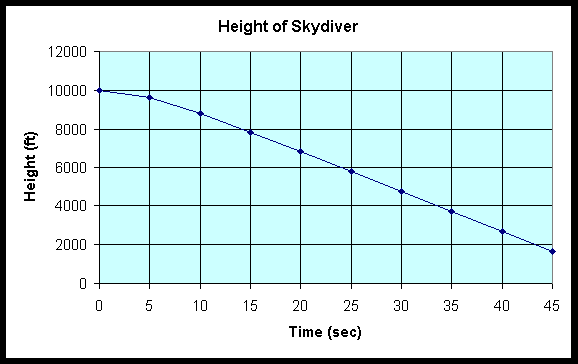
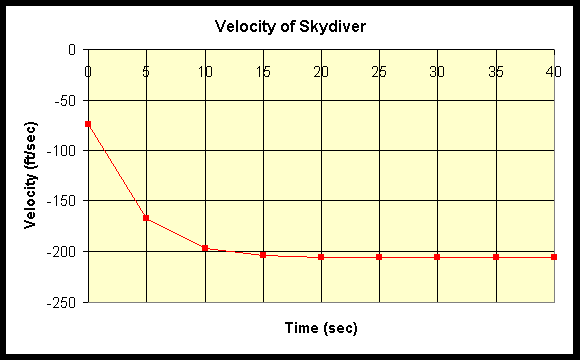
Plot a graph of the Height vs. Time, then by using the successive rows of the table, approximate the velocity (in ft/sec) of the skydiver at each of the times listed in the table from 0 to 40 and graph this velocity curve. What is the approximate velocity in miles per hour at 30 seconds into the fall? Can you estimate when the skydiver would hit the ground if the parachute failed to open?
Solution: A plot of the graph for the height of the skydiver as a function of the time free falling is shown below.

Notice that the shape of this graph is not parabolic, like our example of the falling ball. A graph of the velocity of the skydiver is shown below.

We see that the velocity of the skydiver levels off shortly after 10 seconds. This is known as the terminal velocity of the skydiver.
The velocity at 30 seconds is (3703 - 4733)/5 = 206 ft/sec, which is 206(3600/5280) = 140.5 mph.
Since the skydiver is at terminal velocity, after 45 sec, you can assume that the skydiver would continue to fall at 206 ft/sec, so it would take 1643/206 = 8.0 sec to cover the remaining 1643 ft. Thus, the skydiver would fall for about 53 sec if the parachute failed.