Staphylococcus aureus, is a common pathogen that can cause food poisoning. Standard growth cultures of this bacterium satisfy a classical logistic growth pattern. Below we present the data from the laboratory of Professor Anca Segall, where a normal strain is grown using control conditions and the optical density (OD650) is measured to determine an estimate of the number of bacteria in the culture.
|
t (hours) |
0
|
0.5
|
1
|
1.5
|
2
|
2.5
|
3
|
3.5
|
4
|
4.5
|
5
|
|
OD650 |
0.030
|
0.039
|
0.068
|
0.107
|
0.174
|
0.236
|
0.261
|
0.288
|
0.307
|
0.324
|
0.347
|
Most biologists use the continuous version of the logistic growth model for their studies of populations. This model is used very extensively and can be written with the following formula
where P0 is the initial population, M is the carrying capacity of the population, and r is the Malthusian growth rate (early exponential growth rate) of the culture.
a. Use Excel to find the least squares best values of parameters P0, M, and r, then write these values clearly in your lab report. (The Help page or Lab Manual gives details on using Excel's Solver for finding these parameters.) Include the sum of squares error. Also, write the complete formula with the best parameter fit in your report. Create a graph showing both the data and the logistic growth function, p(t). Does this function have any asymptotes, and if so, write them in your report? Do any of the asymptotes relate to the parameters that you found? Give a biological interpretation.
b. The average growth rate, G(t), is given by the formula
First, compute the average growth rate using the data for successive times from t = 0 to 4.5. Graph these growth rates as data points. Next compute the average growth rate using the best fitting function, p(t), at the same times as used to compute the growth rate from the data. Graph these average growth rates as a line over the graph using the data points.
c. Let t0 = 2, then compute the average growth rate, G(t0), using the best fitting function, p(t), with t1 = 3. Repeat this process with t1 = 2.5, 2.1, 2.01, and 2.001. List these average growth rates in a table. The derivative is given by the function
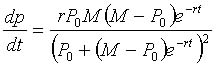
where P0, M, and r were found in Part a. Use this function to compute the derivative at t0 = 2, then find the percent error between the average growth rate computed above compared to this value of the derivative.
d. Graph the derivative of the population function, p'(t),
for t ![]() [0, 5]. Use a stepsize of 0.1 when graphing
the derivative. From the values of the derivative used to graph, find the maximum
of this derivative function and give the time that this maximum occurs. This
maximum is the turning point of the population
or the mid-log phase for this culture of
S. aureus.
[0, 5]. Use a stepsize of 0.1 when graphing
the derivative. From the values of the derivative used to graph, find the maximum
of this derivative function and give the time that this maximum occurs. This
maximum is the turning point of the population
or the mid-log phase for this culture of
S. aureus.