Statistics Package
Maple is probably not the best method for doing a statistical analysis, but it does have some statistical routines that can prove useful when you need some basic statistical operations or visualization of certain ideas. Its strength comes in dealing with probability functions because of its integration techniques. Below we demonstrate an number of the ideas from the text Chapter 22. The listing below shows a variety of operations that can be readily performed by Maple. It certainly covers most of the basics in statistics.
> with(stats);with(stats[describe]);
Warning, these names have been redefined: anova, describe, fit, importdata, random, statevalf, statplots, transform
![]()
Warning, these names have been redefined: coefficientofvariation, count, countmissing, covariance, decile, geometricmean, harmonicmean, kurtosis, linearcorrelation, mean, meandeviation, median, mode, moment, percentile, quadraticmean, quantile, quartile, range, skewness, standarddeviation, sumdata, variance
![]()
![]()
![]()
![]()
The stats package is subdivided into a series of other packages, such as anova, describe, statplots, etc. Above shows all the functions (basic stats functions) in describe and invokes it. We begin by entering a simple list of scores that we want to examine. Many of the commands are pretty self-explanatory.
> S := [87,96,73,95,50,64,73,57,94,59,61,84,94,72,78,83,97,92,79,86,85,64,50,67,95,85,52,72,57,67,16,64,39,76,86,37,72,86,37,72,69,45,53,82,90,57,73,28,89,64,42,77,54,44,31,54,69];
![]()
![]()
![]()
> -sort(-S);
![]()
![]()
![]()
> xbar := mean(S); evalf(%);
![]()
![]()
> xmean := median(S);
![]()
> xmode := mode(S);
![]()
>
var := variance(S); evalf(%);
sdev := standarddeviation(S); evalf(%);
![]()
![]()
![]()
![]()
> with(stats[statplots]):
>
data := [ Weight(10..20, 1), Weight(20..30, 1), Weight(30..40, 4), Weight(40..50, 3), Weight(50..60, 10), Weight(60..70, 9), Weight(70..80, 11), Weight(80..90, 10), Weight(90..100, 8)]:
> histogram(data, color=magenta);
![[Maple Plot]](images/section620.gif)
Suppose we want to examine some probability distributions. These are in the statevalf subpackage.
> with(stats[statevalf]);
![]()
> Digits := 5:
Create the binomial probability function.
> f := seq(statevalf[pf, binomiald[5, 0.55]](x), x = 0..5);
![]()
Create the binomial distribution function.
> F := seq(statevalf[dcdf, binomiald[5, 0.55]](x), x = 0..5);
![]()
> s := seq([[j-1,0],[j-1,f[j]]], j = 1..6);
![]()
![]()
> plot({s},x=0..6, color=BLUE);
![[Maple Plot]](images/section626.gif)
> x := 'x':
> G := x -> piecewise(x < 0, 0, x < 1, F[1], x < 2, F[2], x < 3, F[3], x < 4, F[4], x < 5, F[5], 1);
![]()
> plot(G(x),x=0..10, P = 0..1);
![[Maple Plot]](images/section628.gif)
Let us graph the probability function for the Normal distribution and view the distribution function.
> plot(statevalf[pdf,normald[0,1]](x),x = -4..4);
![[Maple Plot]](images/section629.gif)
> plot(statevalf[cdf,normald[0,1]](x),x = -4..4);
![[Maple Plot]](images/section630.gif)
> f := x -> (1/sqrt(2*Pi))*exp(-x^2/2);
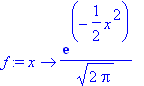
> int(f(x), x = -infinity..2);
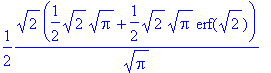
> evalf(%);
![]()
> statevalf[cdf,normald[0,1]](2);
![]()
Here we generate some random numbers, such as might be used in a Monte Carlo simulation.
> rn := rand(1..50):
> RN := [seq(rn(j),j = 1..15)];
![]()
> evalf(mean(RN));
![]()
> evalf(standarddeviation(RN));
![]()
Here we perform some statistics on the list of student scores given above.
> S;
![]()
![]()
![]()
We find confidence intervals (say 95%).
> xbar := evalf(mean(S));
![]()
> var := evalf(variance(S));
![]()
> sqvar := sqrt(var);
![]()
> conf1 := statevalf[icdf, normald[xbar,sqvar]](0.05);
![]()
> conf2 := statevalf[icdf, normald[xbar,sqvar]](0.95);
![]()
Thus, we should see 90% of the exam scores between 36 and 99, if I'm interpretting this statistical analysis correctly. Since 3 of 54 scores lie outside the 90% confidence level, this seems to agree pretty well.