Example 24.1
We will show that
![]() is a solution to the BVP in Table 24.1 when
is a solution to the BVP in Table 24.1 when
![]() , and
, and
![]() . A calculation shows
. A calculation shows
![]()
and
![c^2*u[xx] = 3^2*(-sin(x))*cos(3*t)](images/plucked_string33.gif)
To implement this calculation in Maple, set
![]() so
so
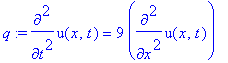
 in the equation
> q := diff(u(x,t),t,t) = 9*diff(u(x,t),x,x);
>
Write
![]() as
as
> U := sin(x)*cos(3*t);
![]()
>
and make the substitution
> simplify(subs(u(x,t)=U,q));
![]()
>
Moreover,
![]() = 0, as we see by
= 0, as we see by
> eval(subs(x=0,U));
![]()
>
and
> eval(subs(x=Pi,U));
![]()
>
Finally,
![]() =
=
![]() , as we see by
, as we see by
> eval(subs(t=0,U));
![]()
>
Figure 24.2 consisting of Figures 24.2a and 24.2 b, shows the shape of the string at two different times.
Figure 24.2a is
>
U := sin(x)*cos(3*t):
p1 := plot(subs(t=.3,U),x=0..Pi,color=black, scaling=constrained, xtickmarks=[0], ytickmarks=[-1,1], labels=[x,u], labelfont=[TIMES,ITALIC,12]):
p2 := textplot([Pi,-.1,`p`],font=[SYMBOL,10]):
p3 := textplot([2.7,.56,`t = .3`]):
display([p||(1..3)]);
![[Maple Plot]](images/plucked_string46.gif)
>
and Figure 24.2b is
>
p1 := plot(subs(t=1.5,U),x=0..Pi,color=black, scaling=constrained, xtickmarks=[0], ytickmarks=[-1,1], labels=[x,u], labelfont=[TIMES,ITALIC,12]):
p2 := textplot([Pi,-.1,`p`],font=[SYMBOL,10]):
p3 := textplot([2.7,-.25,`t = 1.5`]):
display([p||(1..3)]);
![[Maple Plot]](images/plucked_string47.gif)
>
Figure 24.3 shows the solution surface whereby
![]() is graphed as a surface in the
is graphed as a surface in the
![]() -plane.
-plane.
>
p1 := plot3d(U,x=0..Pi,t=0..4*Pi/3, axes=frame, labels=[` x`,` t`,`u `], labelfont=[TIMES,ITALIC,12], color=red, style=hidden, tickmarks=[3,4,3], orientation=[45,60]):
p1;
![[Maple Plot]](images/plucked_string50.gif)
>
Figure 24.4 shows several snapshots of the string superimposed on the solution surface.
>
F := z -> spacecurve([x,z,sin(x)*cos(3*z),x=0..Pi], color=black, thickness=3):
p2 := display3d([seq(F(2*Pi/30*k),k=0..20)]):
display3d([p1,p2],orientation=[25,80], scaling=constrained, axes=frame);
![[Maple Plot]](images/plucked_string51.gif)
>
The solution surface is traced out in time by a succession of moving images of the dynamic string, or equivalently, the plane sections of the solution surface are snapshots in time of the physical motion of the string. The obvious animation of the string tracing out the solution surface follows.
>
p2 := display3d([seq(F(2*Pi/30*k),k=0..20)], insequence=true):
display3d([p1,p2],orientation=[25,80], scaling=constrained, axes=frame);
![[Maple Plot]](images/plucked_string52.gif)
>
Figures 24.3 and 24.4 show that the motion of the string is an example of a standing wave because the points of zero displacement do not translate along the string.
In fact, a complete animation of the motion of the string is given by
> animate(U,x=0..Pi,t=0..2*Pi/3, frames=20, color=black, labels=[x,u], labelfont=[TIMES,ITALIC,12], xtickmarks=3, ytickmarks=3);
![[Maple Plot]](images/plucked_string53.gif)
>