|
|
Math 122 - Calculus for Biology II |
|
|---|---|---|
|
San Diego State University -- This page last updated 15-July-01 |
|
|
Math 122 - Calculus for Biology II |
|
|---|---|---|
|
San Diego State University -- This page last updated 15-July-01 |
These worked examples begin with two basic separable differential equations. The method of separation of variables is applied to the population growth in Italy and to an example of water leaking from a cylinder.
Example 1: Solve the following separable differential equations.
|
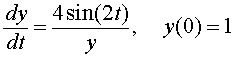
a. |
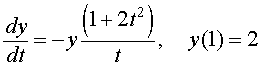
b. |
Solution: a. We begin by separating the variables and creating the two integrals,
The integrals are evaluated giving
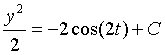
or
This is solved for y(t) to give
We evaluate the arbitrary constant C using the initial condition. Because y(0) = 1, we take the positive square root. Thus, we have
It follows that 2C = 5, so the solution is
b. As in Part a, we begin by separating the variables and creating two integrals. The result is
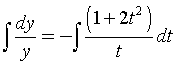
The integral on the left gives
while the integral on the right requires splitting into two integrals, which are solved in the following manner,
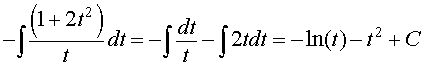
Note that we add the arbitrary constant to the integration on the right. Thus, we have
We exponentiate both sides of the equation above, then use our rules of exponentiation to obtain
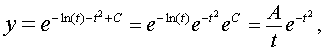
where A = eC.
Next we substitute the initial condition y(1) = 2 (y = 2 and t = 1), so
This gives the solution

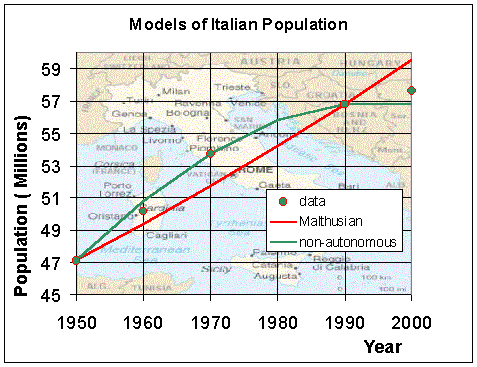
Example 2: For the last few decades, Italy has had its growth rate decline to where soon the country will not even have enough births (or immigration) to replace the number of deaths in the country. Thus, its population may soon start declining. The population of Italy in 1950 was 47.1 million, in 1970 it was 53.7 million, and in 1990 it was 56.8 million.
a. Use the data in 1950 and 1990 to find a Malthusian growth model for Italy's population.
b. Consider the nonautonomous Malthusian growth model given by the differential equation
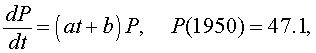
where the constants a and b are to be determined by the data. Solve this differential equation with the data above.
c. If the population of Italy was 50.2 million in 1960 and 57.6 million in 2000, then use each of these models to estimate the populations in 1960 and 2000 and determine the error between the models and the actual census values. Graph the solutions of the two models and the data points from 1950 to 2000.
d. Find when Italy's population levels off and begins to decline according to the nonautonomous Malthusian growth model.
Solution: a. The differential equation for Malthusian growth is given by
The general solution to this model (for the population in millions) is
In 1990 the population was 56.8 million, so
Thus,
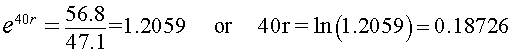
It follows that
The solution to the Malthusian growth model is
b. We follow the lecture notes in solving the nonautonomous Malthusian growth model. The model given above is separable by dividing both sides by P, leaving the two integrals to solve:
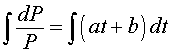
These integrals give
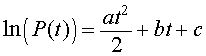
for some constant c. This means that there are three constants to be solved for with the data given at the years 1950, 1970, and 1990. It becomes easier to solve for the constants, if we make a translation to 1950, so write the previous equation in the form
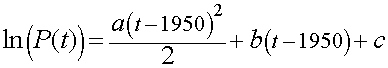
where the constants b and c are slightly different from the previous equation.
By using the initial data in 1950, we have
Next we substitute the data from 1970 with (t - 1950) = 20 and using our value of c = ln(47.1), so
Similarly, with the data from 1990 with (t - 1950) = 40 and c = ln(47.1), we obtain the equation in the unknown parameters a and b
This becomes a problem of solving two linear equations in the two unknowns a and b. If we multiply the equation from the 1970 data by -2, then add it to the equation from the 1990 data, then the parameter b vanishes.
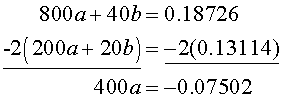
It follows that
By substituting this value of a into either of the equations above, we obtain that
It follows that the solution is given by
By exponentiating the solution above, the population of Italy given by the nonautonomous Malthusian growth model satisfies
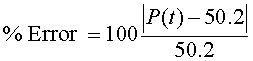
c. Below is a table of the values for each of the models in 1960 and 2000 and the associated errors, where the populations are in millions. The values for the populations are obtained by substituting 1960 and 2000 for t in the equations above.
|
Model |
1960 |
%
Error |
2000 |
%
Error |
|
Italy
Census Data |
50.2 |
- |
57.6 |
- |
|
Malthusian |
49.4 |
1.7% |
59.5 |
3.3% |
|
Nonautonomous |
50.8 |
1.1% |
56.8 |
1.4% |
The percent error is computed by the standard formula, so for 1960 we evaluate
Below is a graph of the two models and the data. Both models are reasonably close to the data, but the nonautonomous Malthusian growth model fits the data a little better.
d. From our calculations above, we have the differential equation for the nonautonomous Malthusian growth model is given by
where t is in years after 1950.The population growth slows to zero, so the population levels off, when P'(t) = 0. This occurs when
Since P(t) is not zero, we need to find when
which happens when
It follows that the nonautonomous Malthusian growth model predicts that Italy's population leveled off in 1995 (45 years after 1950). The most recent data indicated that 2000 was the peak of Italy's population, so the model does a reasonable job of approximating the leveling off of Italy's population.
Example 3 (Torricelli's Law): One method of delivering water at a slow rate for irrigation of vegetation is to put a small hole in the bottom of a cylindrical tank. The water leaks out slowly over a period of time to provide extended irrigation. Water flowing from a hole in the bottom of a reservoir of water satisfies Torricelli's law.
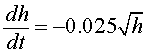
Torricelli's Law: The rate of change of volume of water flowing from a reservoir (V) with a hole in the bottom of the tank is proportional to the square root of the height of the water above the hole (h). Mathematically, this is given by the differential equation:
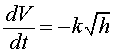
This equation is derived using basic physics with the assumption that the sum of the kinetic and potential energy of the system remains constant. Below is a diagram of the water flowing from a cylinder.
Since we are considering a cylindrical reservoir of water, the volume of water in the reservoir is equal to the cross-sectional area (A) of the cylinder times the height of the water (h) with A remaining constant and h(t) varying with time (decreasing). Thus,
Since A is a constant for a cylinder, we have that
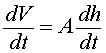
It follows that we can write a differential equation for the flow of water from a tank by the equation
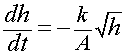
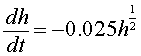
Suppose that a reservoir with a 20 cm radius begins with a height of 144 cm of water. When the hole is unplugged, the water begins flowing out satisfying Torricellli's law and irrigating the experimental plot. Suppose that an experimental measurement gives the constant k/A = 0.025 hr-1.
a. Find the height of water in the reservoir at any time for this experimental irrigation system.
b. Determine how long until the reservoir is empty.
c. What is the average hourly amount of water (in cm3/hr) delivered by this irrigation system. Also, find the volume of water (in cm3/hr) that is flowing after 100 hours and 800 hours.
Solution:
a. The differential equation for the height of water in the reservoir is written in the following form, using a power (1/2) for the square root,
This differential equation is solved using the separation of variables technique. The variables are separated with the dependent variable h in the integral on the left below and the independent variable t in the integral on the right below. Thus, we have the two integrals below to solve
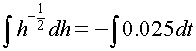
These two integrals are easily solved, giving the following equation
This equation is solved explicitly for h(t) by dividing by 2 and squaring both sides, resulting in the equation
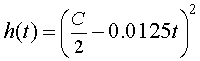
Next we use the initial condition h(0) = 144 to find the constant C. With the initial condition, it follows that
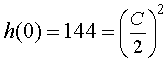
or
C = 24.
Thus, the solution is given by the equation
A graph of the solution for the height of the water is given by
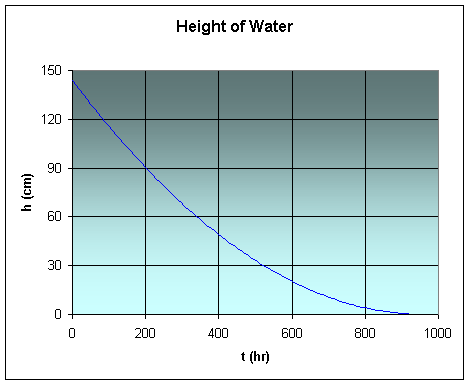
b. The reservoir is empty when h(t) = 0. Thus, we must solve the following:
It follows that
or
t = 960 hr.
The reservoir empties in 960 hours or 40 days.
c. The total volume in the reservoir is V = p(20)2144 = 57,600 p = 180,956 cm3, so on average the amount of water delivered to the plant over the 960 hours before the reservoir empties is about 180,956/960 = 188.5 cm3/hr.
To compute the amount of water being delivered at 100 hours and 800 hours, we need to use the differential equation. From the information on Torricelli's Law given above, the volume of water flowing from the reservoir is given by
with
so
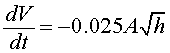
Thus, we need to compute the cross-sectional area of the cylinder A and determine the height of water at t = 100 and 800 hr. The cross-sectional area satisfies
The height of the water at t = 100 and 800 hr is given by
and
h(800) = (12 - 0.0125(800))2 = (2.0)2 = 4.0 cm.
The volume flowing out of the reservoir at t = 100 satisfies
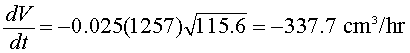
while the volume flowing out of the reservoir at t = 800 satisfies
![]()
The negative in each of these answers for dV/dt indicates that the water is flowing out of the reservoir. We can easily see that at t = 100, the water flowing from the reservoir is above the average outflow, while at t = 800, the outflowing water is below the average.